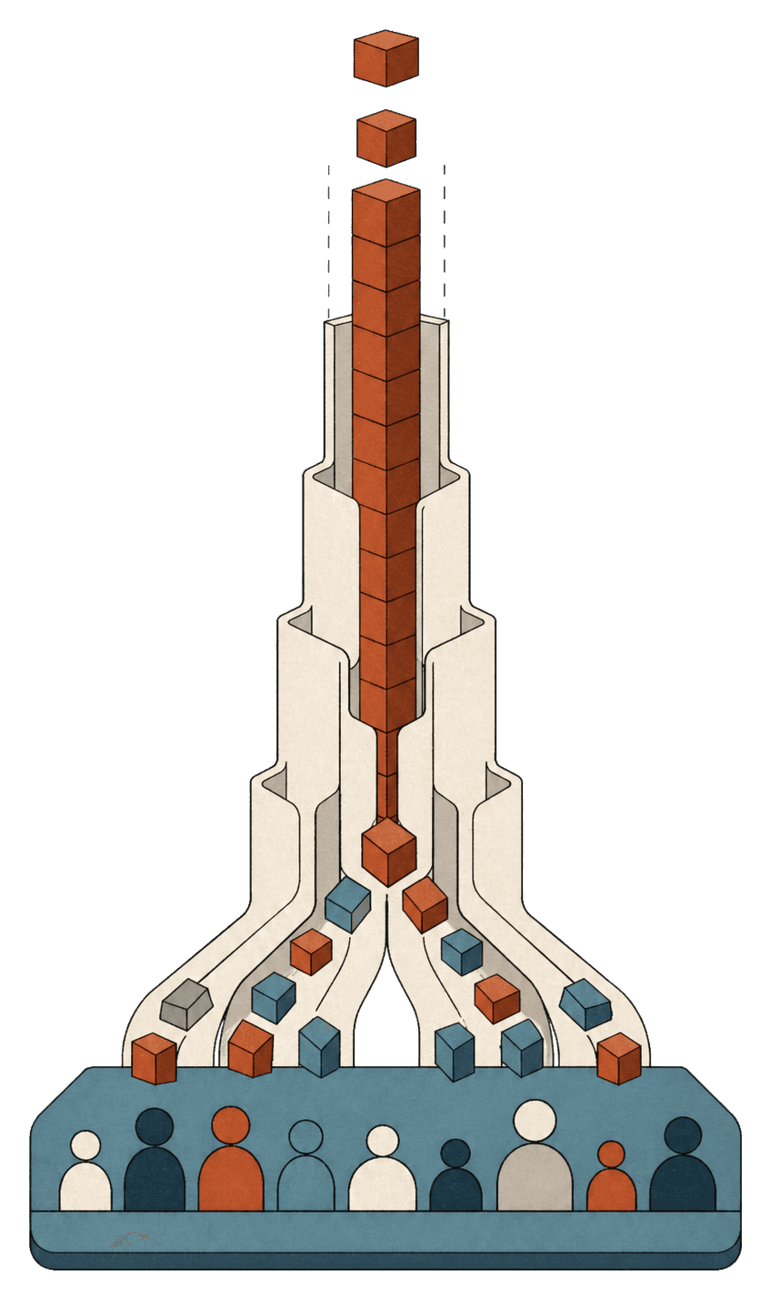
Early advantage compounds · other possible futures disappear

Shadow Futures

Contribution Uncertainty and the Self-Reinforcing Market

A market can reward real contribution while erasing the evidence needed to measure it.

In some markets, each win makes the next win easier. Success brings more attention, customers, capital, data or distribution to the leader, while others lose the chances they need to show what they could’ve contributed. Over time, the market records the winner’s path in extraordinary detail but stops producing the comparisons needed to tell how much success came from contribution and how much came from already being ahead. Those missing experiments are shadow futures.

What’s new here

A million transactions can still add up to only one experiment.

Many transaction tiles circulate around one track and pass through a single observation window, while dashed alternative tracks remain unrealized.

Economists already know that early success can compound. This paper asks a different question: when each win changes who gets the next chance, can one long market history still tell us how much of the final gap came from the winner's work?

A simple analogy

One product gets moved to the front shelf.

A shop moves one product to the front after its first sale. Front placement brings more sales, and each sale keeps it in front. After a year, the shop has thousands of receipts but only one shelf history.

One product is repeatedly promoted by sales on the observed shelf, while a faint second shelf shows the unrealized rerun with a different product in front.
Observed shelf historyMissing rerun

More receipts don’t mean more experiments. To separate product quality from placement, we’d need to rerun the shop with a different product in front. Those missing reruns are shadow futures.


What’s already familiar

Why an early winner keeps winning

Increasing returns, lock-in, cumulative advantage and preferential attachment already explain how an early lead can grow.

What this paper adds

When that process destroys the evidence needed to explain the winner

At every step, Shadow Futures measures the chance that someone other than the current leader gets the next reward. It adds those chances to the comparison budget. If that total is finite, the paper proves that no method using only one market history can consistently recover how much of the reward came from contribution, even when work and quality are observed and new transactions keep arriving.

The literature gap, stated carefully

The paper doesn’t claim that lock-in or cumulative advantage is new. Arthur's Competing Technologies, Increasing Returns, and Lock-In by Historical Events (1989), David's Clio and the Economics of QWERTY (1985), and Merton's The Matthew Effect in Science (1968) establish those foundations.

Pemantle's A Survey of Random Processes with Reinforcement (2007) maps the reinforced-process literature, Oliveira's The Onset of Dominance in Balls-in-Bins Processes with Feedback (2009) proves a dominance result, and Bar-Yam's From Big Data to Important Information (2016) distinguishes abundant records from the information needed to evaluate interventions. Hayek's Competition as a Discovery Procedure (2002) gives competition its familiar discovery role.

The closest statistical precedent is Le Goff and Soulier's Parameter Estimation of a Two-Colored Urn Model Class (2017), which proves an estimation failure in that narrower urn setting. Shadow Futures adds a market-level comparison budget tied to a single-history impossibility theorem for contribution attribution. It also gives competition an additional role: independent market paths are the replications needed to learn why outcomes diverged.

01 / How a platform manufactures the chart

A platform can bury talent before it has a chance to become visible

Imagine 24 creators with a realistic spread of promise: some work will connect more strongly than others. But promise only becomes visible when people get to encounter the work. An early entrant who receives the first audience also gains followers, feedback, income and time to improve. The platform then reads those advantages as reasons to keep promoting them.

Creator cards remain screened at the bottom while one card rides a feedback staircase upward.
One platform chart in motion
Creators differ. The feed decides whose promise gets enough chances to grow.
One creator’s early exposure becomes a runaway platform leadTwenty-four creators have different levels of modeled audience response. Small early differences in exposure are amplified until one creator receives much more of the platform’s attention. The ten leading observed paths are shown.0%25%50%75%100%first recommendationrecommendation 1,600
#1Creator 1984%
#2Creator 218%compared below
#3Creator 232%compared below
#4Creator 21%
#5Creator 61%
#6Creator 171%
#7Creator 101%
#8Creator 90%
#9Creator 110%
#10Creator 180%
Two shadow paths, separated from the crowd

What changes when the platform reopens discovery?

Same creator, same modeled audience response and same random sequence. Only the accumulated ranking score resets after recommendations 400, 800 and 1,200.

Original #2Creator 21
+3 points
Observed ranking8%
Ranking reset11%
Original #3Creator 23
+7 points
Observed ranking2%
Ranking reset9%

The intervention clears accumulated visibility scores, not prior views or modeled audience response. These are policy counterfactuals, not claims about a creator’s guaranteed potential.

Talent can improve the odds. It can’t be amplified if the platform stops showing the work.

one creator gets an early breaksocial media shows them to more peoplethey gain more followersrecommendation systems show them even more

The ranking measures a shaped history

Better work can improve someone’s chances. But the final follower count combines audience response with every extra opportunity created by earlier visibility.

Unseen talent leaves almost no evidence

If the feed stops testing a creator, the absence of followers may tell us more about missing exposure than about the quality of what they could’ve built.

The chart we saw: one ranking after earlier rankings had already decided who received the chances to grow.

The shadow charts: the other plausible rankings hidden by the one launch that actually happened.

02 / The familiar story and the missing question

The problem isn’t simply that success compounds. It’s what compounding erases.

Increasing returns and preferential attachment explain why an early lead can grow. Shadow Futures asks what happens to the evidence: once that lead has shaped thousands of later decisions, can the one history we observe still tell us how much the winner contributed?

Alternative branches are cut off as feedback loops feed one recorded path.
Attention

Instagram, TikTok, YouTube and Twitch rank creators for enormous shared audiences.

Subscriptions

OnlyFans, Fanvue, Patreon and Substack turn an audience lead into recurring income.

Work and sales

Upwork, Fiverr, Etsy, Amazon and app stores carry reviews and rankings into each new sale.

Knowledge

Popular search results and papers are easier to find and cite, so they can become even more popular.

The familiar question

Why does the winner keep winning?

Increasing returns, scaling laws, network effects and preferential attachment explain how early success can grow into market concentration.

What Shadow Futures adds

What can the market no longer teach us?

When one path crowds out the chance to test others, the market loses the comparisons needed to separate contribution from position in the final score.

A market can be extremely busy while producing almost no new evidence. Ten million views, sales or contracts can keep extending one inherited path instead of testing how the same inputs would’ve performed on another.
Social media makes 1,600 recommendations
How much opportunity remains for anyone besides the current leader?
What the vertical axis measuresThe average chance that the next recommendation goes to anyone except the current leader.

If the leader has a 70% chance of receiving the next recommendation, the other 23 creators together have 30%. A higher line means the recommendation system keeps more alternative paths open.

Average chance that anyone except the current leader is recommended nextOne rule keeps boosting the current leader. The other resets every creator to equal visibility ten times. A higher line means someone else is more likely to be recommended.average chance anyone else is recommended0%25%50%75%100%recommendation 1recommendation 1,600

If social media keeps boosting the early leader, everyone else gets fewer real chances to be seen.

The familiar kind of monopoly

One company controls prices or access

The company can charge more, set the rules, or keep competitors out.

The paper’s epistemic monopoly

One history controls the evidence

Thousands of creators or firms can remain in the market while one ranking, standard or route to customers determines which paths get recorded. What it monopolizes is the evidence society needs to explain the outcome.

The Shadow Futures result
Transactions aren’t the sample size. Real chances for the market to go another way are.

The paper calls the total of those chances the comparison budget. If that budget is finite, no method using a single market history can consistently recover a meaningful measure of contribution that rises or falls when contribution does. More activity can lengthen the same path without adding the missing experiments.

03 / From scale to evidence

A growing firm can look like a winner even as its true contribution becomes harder to measure

An early customer brings revenue, data, credibility and scale. Those can produce real gains. But as one firm comes to dominate customers, standards and distribution, the market can run out of independent paths that would reveal how much success came from the firm’s inputs and how much from the position created by earlier wins.

A contract, performance data, a factory and the next customer form a reinforcing loop.

AI and cloud computing

Models, chips and data centers require enormous up-front investment. More customers can fund more capacity, lower average costs and sometimes provide data that improves the service.

Manufacturing and logistics

A larger order book can pay for better machinery, cheaper purchasing and wider distribution. Those real efficiencies can make the largest supplier cheaper still.

Software and technical standards

A large installed base attracts integrations, trained workers and compatible products. Switching becomes costly even when another firm has a strong alternative.

Finance and large contracts

A proven sales record can unlock cheaper capital and make a firm look like the safe choice for the next major buyer or government contract.

The public claim on scale

Scale should serve the public, not prove what a firm deserves

Lower costs, better reliability, larger research budgets and useful standards are collective economic gains. They don’t turn market power or profit into a precise measure of contribution.

A measurement problem

Market share isn’t an exact contribution score

Today’s profit can reflect better products and the advantages created by yesterday’s sales. One observed market path can’t always separate the two.

A competition problem

Many firms can still offer only one useful test

A market can contain many legal competitors while buyers, standards, financing and distribution all converge on the same early leader.

A policy problem

Mergers can erase valuable comparisons

Merger review should ask whether independent products, experiments and routes to customers will disappear, not only whether several company names remain.

The goal isn’t to freeze every firm at equal size. It’s to prevent today’s leader from closing tomorrow’s contest. When feedback loops can eliminate real comparisons, open standards, interoperability, independent procurement trials, support for new entrants and structural separation can serve as democratic infrastructure.
04 / What inequality can’t answer

The Lorenz curve is the symptom. Shadow futures are the missing evidence.

Debates about extreme inequality often split between two stories. One says the reward broadly reflects talent, work or risk. The other says a small early accident was amplified by cumulative advantage. Shadow Futures reframes the argument: the same visible curve can reflect many different mixes of contribution and reinforced position, and a single market history may not contain the comparisons needed to tell them apart.

Contribution and reinforced position intertwine beneath the same visible Lorenz curve while other mixtures remain unobserved.
Common interpretation 1

The winner contributed proportionally more

A huge reward is taken as evidence of much greater talent, effort, judgment or risk-bearing. The final gap looks like a contribution score.

Common interpretation 2

A small early accident became a giant lead

Cumulative advantage and preferential attachment show how an early break can attract more attention, customers and rewards until inequality becomes extreme.

What Shadow Futures changes

The curve can’t tell us how much of either story is true

Talent, effort and risk can matter while early position compounds. Because the market records only one path, the same final inequality can fit very different mixtures of contribution and reinforced advantage.

Once comparison becomes a design target, the question becomes practical: can a platform keep more alternatives testable while reducing the concentration created by an inherited lead?

A comparison-preserving intervention
Keep alternatives testable, then watch concentration fall.
Income concentration before and after preserving comparisonA rust curve shows the reinforcing baseline. A blue curve appears when a rule preserves at least half of each next-recommendation chance for creators other than the current favorite.0%0%25%25%50%50%75%75%100%100%equal distributionbaseline: bottom 75% receive 3%creators, lowest to highest incomeshare of all creator income
Reinforcing baselineThe ranking can keep spending attention on its current favorite.
Comparison-preserving ruleAt least half of the next-recommendation chance stays outside the favorite.
Comparison budget273?Cumulative chance for someone else to receive the next recommendation
Top three income share94%?Lower means income is less concentrated at the top
Creators with meaningful reach2?Creators receiving at least 2% of modeled exposure
How shadow futures guide policy

Treat the comparison budget as something institutions should protect.

Modeled in the blue curve

Reserve discovery for alternatives

When the favorite’s lead starts closing the contest, redirect enough exposure to keep challengers genuinely testable.

Real-market counterpart

Make audiences and data portable

Interoperability and portability stop one platform from owning every route to reputation, customers and distribution.

Real-market counterpart

Keep trials independent

Separate rankings, procurement trials and public options create new paths instead of extending the winner’s inherited history.

The rust curve is the reinforcing baseline. Apply the blue rule to keep alternatives in the experiment and compare the resulting competition and concentration.

The comparison budget is also a design target.Platforms and policymakers can preserve independent chances to learn, compete and grow before one path becomes the only path the market records.

OnlyFans and Fanvue

A curve built from verified payouts would show how subscription income is divided among creators. Even a perfect curve couldn’t reveal whether the inequality came from better work, an existing following, early discovery, referrals, investment or simply being shown first and then shown again.

YouTube, TikTok, Twitch and Instagram

Views, followers, recommendations and sponsorships can reinforce one another. The visible earnings curve records the result of that history, not the missing histories in which different creators received the early audience.

Patreon, Substack, Spotify and marketplaces

Subscriptions, playlists, reviews and rankings can carry yesterday’s position into tomorrow’s income. Some platform rules leave newcomers more room to break through than others.

Both curves are model illustrations, not forecasts or OnlyFans or Fanvue payout data. The blue curve models one narrow rule: once alternatives’ combined chance would fall below 50%, the ranking reserves enough discovery to preserve that comparison floor. Portability and independent trials are related institutional examples, not additional inputs to the plotted simulation. A real Lorenz curve would require individual creator earnings; company totals aren’t enough.

05 / Tax, UBI and social insurance

The income record can’t isolate contribution from position

Existing tax systems use observable measures such as income, profits and wealth; they don’t try to calculate how much of each dollar came from the recipient’s contribution. The paper asks whether one market history could ever isolate the share created by position. Under the theorem’s conditions, it can’t. That means extreme rewards shouldn’t be treated as proof that recipients deserve every dollar. Progressive taxation, antitrust, UBI and social dividends each address a different part of the problem.

A narrow tower of rewards is partly distributed through channels into a broad floor supporting many people.
A theoretical benchmark

Could a tax isolate only positional rent?

The paper tests this demanding ideal to find the limits of what a market record can reveal. Current tax systems generally don’t attempt this calculation. The result limits claims about exactly what someone deserves; it isn’t a description of ordinary tax administration.

A democratic guarantee

“Give everyone a basic floor.”

A universal basic income or social dividend recognizes that everyone depends on shared institutions, infrastructure, knowledge and demand. It provides a floor without turning survival into a merit contest.

Tax extreme rewards progressively

The largest creator incomes, founder gains and monopoly profits combine real contribution with advantages that scale and history magnify. Higher rates are justified by ability to pay, concentrated power and the public systems that made those gains possible.

Use antitrust to keep alternative paths open

Merger enforcement, interoperability, structural separation and public options can prevent one platform, standard or distribution channel from becoming the only experiment society gets to observe.

UBI takes survival out of the merit contest

A universal floor follows people through unstable work, automation and algorithmic exclusion. Nobody should lose the basics of life because a market stops choosing them.

A social dividend recognizes shared production

Technology, public research, infrastructure, institutions and accumulated knowledge are collective inheritances. Part of the income they generate should return to everyone.

06 / The distinct contribution

The market doesn’t just choose a winner. It chooses what can still be known.

Increasing returns explain compounding. Scaling laws relate size to performance. Preferential attachment explains why success attracts more success. Lorenz curves describe inequality. Shadow Futures identifies the missing step: self-reinforcing markets can destroy the comparison paths needed to measure contribution from the one history we observe.

Several possible paths approach a selector, but only one continues into the market record.

One observed market. Many missing experiments.

Shadow Futures

Contribution Uncertainty and the Self-Reinforcing Market